
Daily Market Analysis and Forex News
US Dollar index at crossroads: rebound or breakdown ahead?

- US Dollar index at lows testing a key support zone last seen in late 2024
- Recent rebound has seen it rise 1.3%, to face major resistance at key moving averages
- Weak consumer confidence data adds pressure, with unemployment claims in focus
- Markets await April 2 "Liberation day" for potential tariff relief
- Failure to break the 200-period SMA could see the index drop to key support levels
Did you know that the US dollar index (USDInd) is currently at multi-month lows?
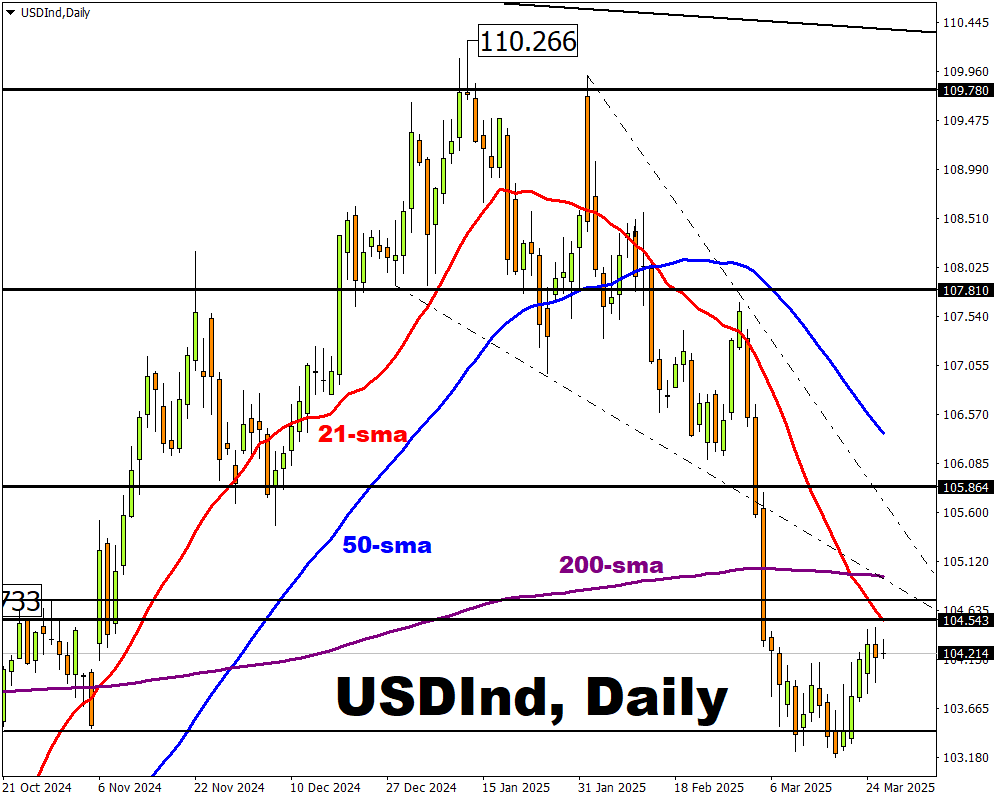
It’s in a critical zone previously tested from October 18, 2024, to November 6th 2024, when it rallied a formidable 3.5% following a breakout.
Since reaching its most recent swing low 19, the US dollar index has surged 1.3%, consistently hitting significant near-term resistance levels and reaching new highs daily.
In the same vein the EURUSD made new lows within the same period.
As we approach April 2 – dubbed "Liberation day" because of the Trump Tariff – economists are cautiously optimistic that the tariffs will be less stringent as initially thought.
At the time of writing, the US dollar Index is dealing with head winds of a weak consumer confidence data, released yesterday March 25th, at its lowest levels in 4-years (92.9% – actual vs 94.0% – expected).
Traders and Investors will now turn their attention to Unemployment Claims due tomorrow March 27th for more signs of a potential reviving of US exceptionalism.
The USDInd bulls may pay attention to the following potential resistance levels:
- 104.538 – 21-period simple moving average (SMA)
- 104.721 – Significant resistance zone
- 104.921 – 200-period SMA
- 105.864 – Key price level
If the USDIndex fails to close above its 200-day simple moving average this may encourage the index bears (those looking to see it decline) to pay attention to the following potential support zones:
- 103.927 – 261.8 fibonacci level
- 103.182 – Most recent swing low

Ready to trade with real money?
Open accountGateway to global opportunity
Join more than 1 million traders worldwide using Alpari as a gateway to a better life.